One chart explains why Americans don’t feel great about the economy with stocks at record highs

It’s increasingly hard for workers’ wages to keep pace with the rising cost of everyday essentials.
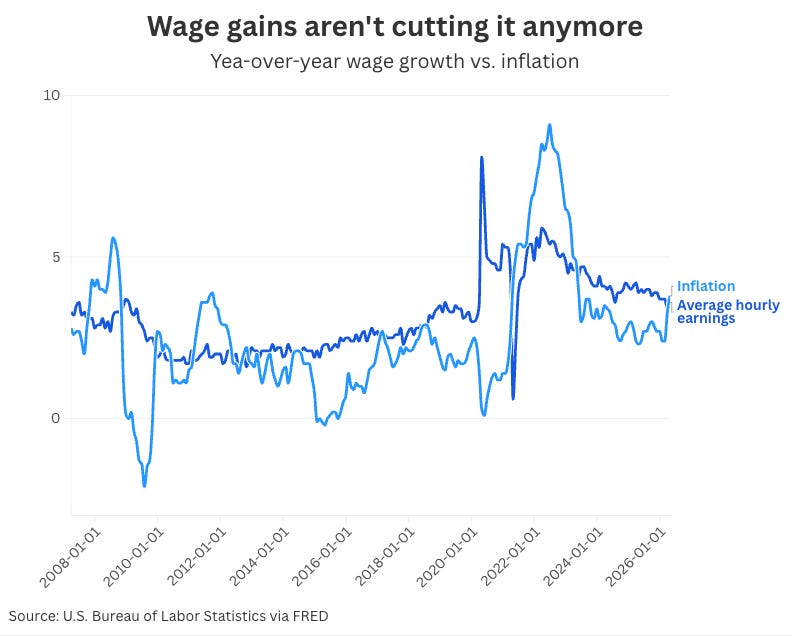
Economic data released in the past week showed consumer prices increased 3.8% from the year prior in April. Meanwhile wages increased 3.6% year-over-year. After a large spike in the past two months, inflation is outpacing wage growth for the first time in three years.
As our Chart of the Week shows, this isn’t a common occurrence. In fact in the past 20 years, it’s only happened three times. One of them was during the Great Financial Crisis, and the other two came primarily in 2011 and 2022, two years headlined by weak economic growth and recession calls.
It’s pretty easy to understand why prices rising more than your check is something that doesn’t sit well with the average American. It’s one of those things contributing to all-time low consumer sentiment.
What’s perhaps harder to square is how this chart is becoming increasingly worse while the stock market keeps reaching record highs. That brings us to two important points. The stock market isn’t the economy. And aggregate economic data is often not reflective of each individual’s lived economic experience.
As we wrote about in April, higher gas prices disproportionately hit lower income wallets. Recent research from the Bank of America Institute points out that those consumers are seeing the lowest wage gains of all, with wages for high-income households growing 6% year-over-year in April (the fastest pace in nearly five years) while low income earnings experienced wage gains of just 1.5%.
That’s the largest wage gap between higher and lower income households since BofA Institute’s data series began in 2015.
“The lower absolute dollar-level of their after-tax wages and salaries, combined with slower wage growth, means that lower-income households have seen just enough growth in their wages over the last year to cover the increase in gas spending in April,” BofA Institute’s team wrote.
As has been well-covered during the K-shape economy discussion of the past year, the pressure on the lower end consumer might not derail overall economic growth. High income earners drive the lion’s share of consumer spending in the US.
It also might not derail the bull market thesis that has multiple strategists calling for another 10% rally in the S&P 500 over the next 12 months.
But as inflation continues to persist as a lingering issue for Americans, the relationship between wages and price pressures helps explain why consumer sentiment remains in the doldrums as stocks push toward new records.
In the Circle
At the Barron’s Investor Circle, our subscription product focuses on engaging directly with readers. We’re providing exclusive stock picks and analysis to help investors navigate the markets. This includes Q&A shows where we answer audience questions live.
We recently introduced a monthly roundtable concept to the show. Our senior technical analyst Doug Busch broke down why the S&P 500 has been indicating a move to 8,000.
Our next monthly roundtable for Barron’s Investor Circle subscribers will be on May 27. You can subscribe to the Barron’s Investor Circle here.
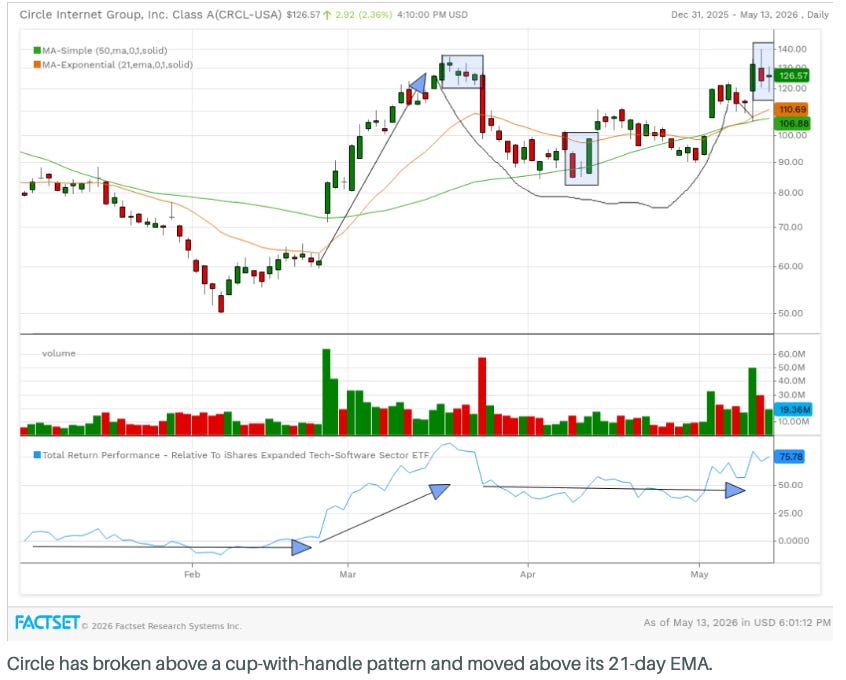
Doug also writes a chart of the week column highlighting one chart where the technicals are starting to catch his eye. This week he took a closer look at Circle.
“One can enter here, and add to above the $140 area, looking at upside projections toward $240 by year-end, representing an 89% gain from current prices. Remain bullish above $108. Circle was trading around $121 Thursday.”
Here are three stories that caught my eye on Barron’s this week:
Ford is now trading like an AI stock. Al Root has the details.
Adam Levine breaks down how Cerebas disrupted chip stocks, and maybe the future of IPOs.
Nick Devor explains how Polymarket’s most contentious bets are settled by crypto token holders.